How customer support reports can improve your team’s performance and customer loyalty

Customer service is something everyone can relate to personally. It’s safe to say we’ve all had poor experiences that left us frustrated and wanting to ditch the vendor. Hopefully, we’ve all had positive experiences, where representatives responded instantly, understood our issues, and resolved them quickly, without escalation.
Would you be surprised at how impactful these experiences are?
- 84% of customers say they’ve had to repeat themselves often or all the time when dealing with customer service. Nearly half say this makes them want to take their business elsewhere.
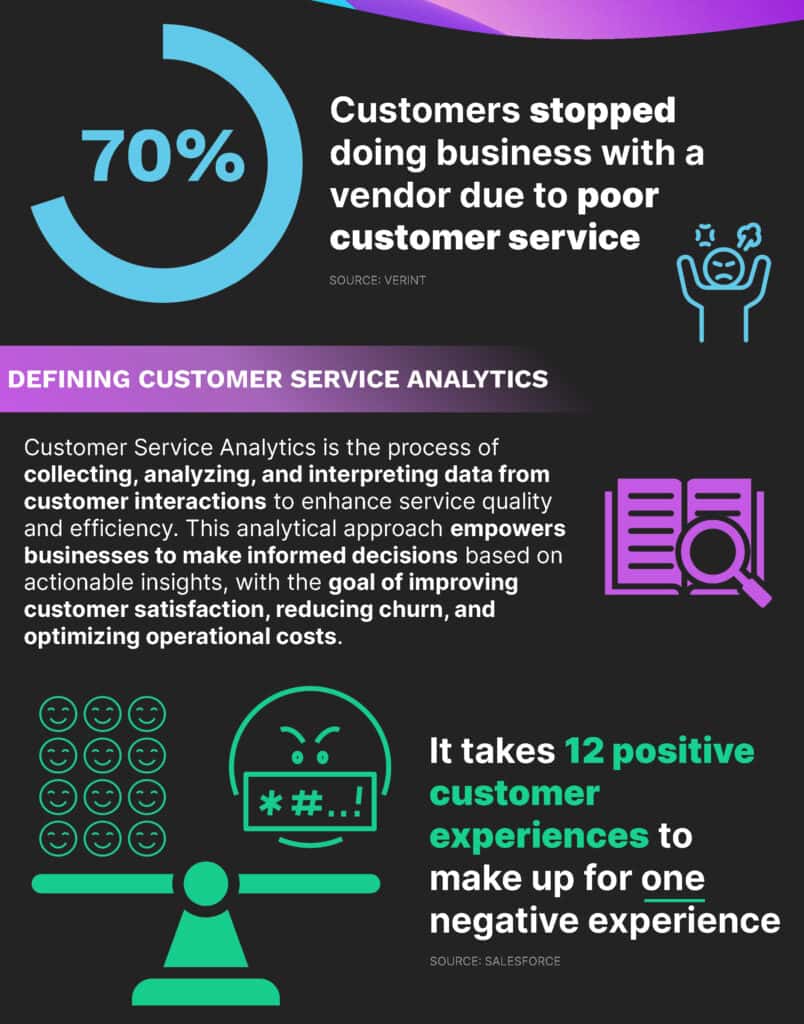
- The majority of Americans decided not to make an initial purchase and 70% stopped doing business with a vendor because of a poor customer service experience.
- It takes 12 positive customer experiences to make up for one negative experience.
We all know acquiring a new customer is expensive. Some say it costs 5%-25% more than retaining an existing one. That’s why best practice is to focus on retaining and growing existing customers.
How can you provide the kind of customer service that makes customers feel good and remain loyal?
By making customer service analytics a core part of your customer support practice.

What is customer service analytics?
Customer service analytics involves collecting, analyzing, and interpreting customer interaction data to improve service delivery. It uses various analytics tools and technologies to convert raw data into actionable insights. When done properly, you gain the customer intelligence needed for proactive, personalized, and effective service. Equally important, your team delights customers and helps reduce churn.
4 types of customer service analytics
- Predictive Analytics
By analyzing past customer interactions and behaviors, companies can predict future customer needs and trends. You can determine which types of customers may have which types of issues. You can also forecast issues before they become significant problems. This enables you to proactively prepare responses or initiate contact before issues arise. - Descriptive Analytics
This involves compiling and analyzing historical data to identify trends that may not be visible through other types of data collection. For instance, analyzing contact volume trends helps in workforce planning. - Diagnostic Analytics
This focuses on understanding the root causes behind customer satisfaction or dissatisfaction. It helps guide organizations on what to fix or enhance. - Prescriptive Analytics
Based on the data analyzed, companies can formulate strategies to address customer needs effectively, improving the overall customer journey.

Essential customer service reports
Customer service leaders and teams aren’t necessarily experts in data analytics. That’s not their core job. That’s why successful leaders rely on customer service reports. The reports serve as a sort of self-service analytics tool that empowers you to make effective data-driven decisions.
Here are the key reports for improving service management, customer service team performance, and customer satisfaction, while minimizing operational costs.
- Volume Reports
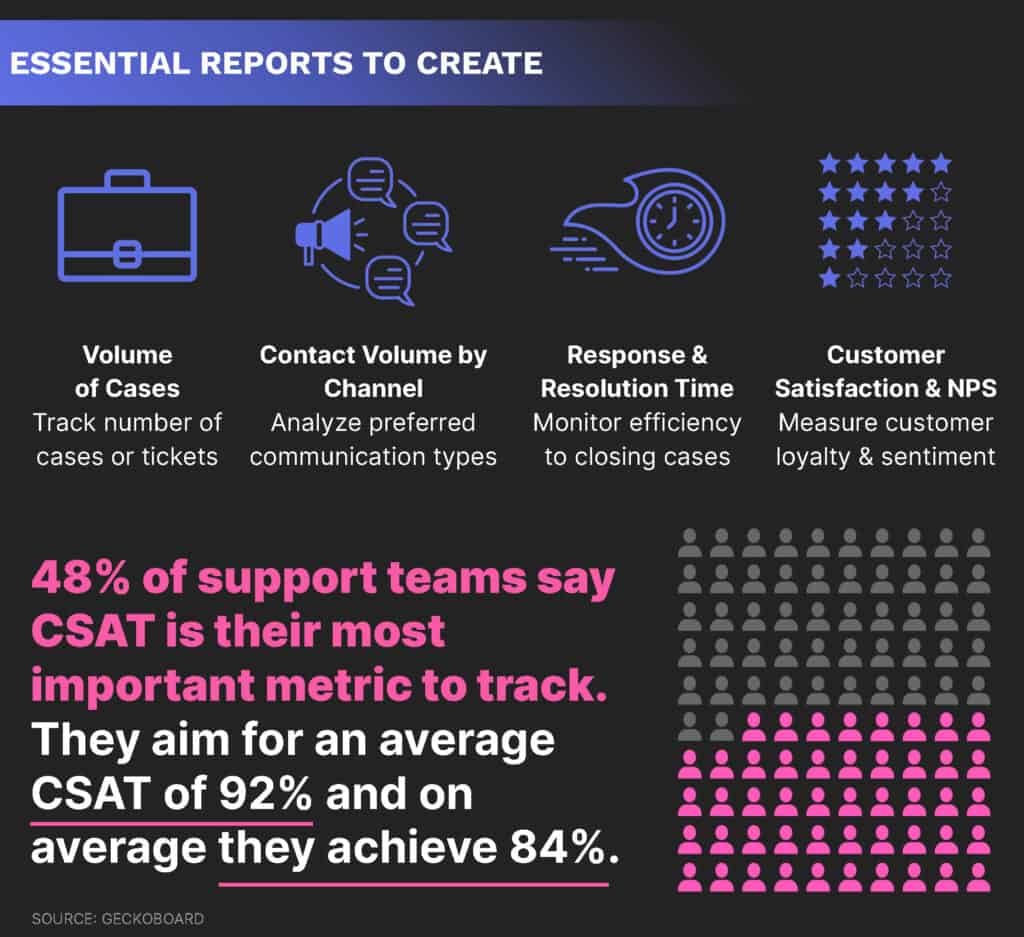
These reports show the number of tickets or cases handled over a specific period. They help in understanding the workload and the distribution of queries by type, urgency, and resolution time. This data is crucial for resource allocation, especially when you consider that 36% of customer service people say team workloads are their biggest challenge.- Ticket Volume Trends
Monitoring changes in the number of support tickets over time can help predict demand and optimize workforce scheduling and management. For example, you may see that demand typically increases for the 5 days following a product launch. You can then schedule more service agents to work during those hours. This way, you won’t cause long wait times for customers. - Contact Volume by Channel
Understanding which channels (phone, email, chat, social media) customers prefer and which generate the most volume can help optimize staffing and technology. For example, shifting traffic to more cost-effective digital channels can reduce overall support costs.
- Ticket Volume Trends
- Response and Resolution Time Reports
These metrics measure how quickly customer support teams respond to and resolve customer inquiries. Monitoring these times helps identify bottlenecks and inefficiencies in the support process. Teams use this data to streamline workflows and improve response times.- Average Handle Time (AHT)
This metric tracks the average duration of a customer interaction, including talk time, hold time, and after-call work. Reducing AHT can lower operational costs by improving agent efficiency without sacrificing service quality. - First Response Time (FRT)
24% of support teams say FRT is their most important metric. But not all companies measure FRT in the same way. Some take a traditional average response time approach. They target the average amount of time it takes, in minutes or hours, for a rep to respond to a ticket. Others set a target response percentage within a time frame. For example, they’ll aim for “90% of tickets responded to within 72 hours.” - First Contact Resolution (FCR)
FCR measures the percent of tickets resolved on the first customer interaction, without the need for follow-ups or escalations. High FCR rates generally indicate more effective customer service and higher satisfaction. They also result in lower costs since you’re using fewer resources in interactions. - Mean Time to Resolution (MTTR)
This tracks the average time taken to resolve issues. The less amount of time, the better.
- Average Handle Time (AHT)
Boost Customer Retention with Insights
Take your data history, get insights, and transform the way you support customers.
- Customer Sentiment, Loyalty and Preferences
These reports are great indicators of customer experience and ways to better support them.- Customer Satisfaction (CSAT)
These stats are derived from post-resolution surveys where customers rate their satisfaction with the service received. Customer satisfaction scores are vital for gauging customer happiness and identifying areas for service improvement. High satisfaction scores can lead to more repeat business and referrals. This lowers the cost of acquiring new customers.
48% of support teams say CSAT is their most important metric to track. One survey said they aim for an average (median) CSAT of 92% – and achieve 84%. - Net Promoter Score (NPS)
NPS measures how likely customers are to recommend a company’s products or services to others. This metric is an excellent indicator of overall customer experience and loyalty. A strong NPS is often associated with lower customer churn and can indicate more effective customer service practices. - Churn Rate
Every company should monitor their churn rate and trends over time. Reducing churn through effective service can significantly lower the costs associated with customer acquisition. - Contact Channel
This reveals customer preferences for different support channels (phone, email, chat, social media). Understanding channel usage can help you optimize resources and improve channel-specific support strategies.
- Customer Satisfaction (CSAT)
- Employee-specific Reports
- Agent Performance
These detail individual support agent metrics. They may include the number of tickets handled, customer issue resolution times, customer feedback, and adherence to Service Level Agreements (SLAs). They are great for identifying training needs and rewarding high performers. - Employee Satisfaction
While often overlooked, employee satisfaction is crucial as it directly impacts turnover rates and productivity. High turnover can also result in poor customer service quality. Use surveys to gather this information and conduct them quarterly. - Issue Category Report
This analyzes the types of support case issues being reported. It helps identify common problems or trends that may require attention from other departments like product development or quality assurance. - Cost Per Contact (CPC) Report
Keeping an eye on CPC helps pinpoint trends in cost efficiency and areas where you can reduce excessive spending. Calculate this by dividing the total operational costs of the service department by the number of contacts handled.
- Agent Performance

5 common customer support teams mistakes
Without customer service intelligence you can’t deliver superior service or meet customer expectations. But, reports alone are not enough.
Too often, customer service teams still fall short in these 5 areas. Make sure you avoid these pitfalls:
- Lack of training and resources
Insufficient training can leave support agents unprepared to handle complex customer issues. Agents must have comprehensive training on your company’s products and services. They also need ongoing training to update their skills and knowledge. Make sure you equip them with easily accessible tools that provide the information they need to resolve customer issues in real-time. - Poor response time
As noted above, delayed responses can exacerbate customer frustrations and lead to negative experiences. It’s vital to ensure that response times are quick. However, too often teams don’t have enough staff for peak times and don’t use automation tools like chatbots to handle routine queries. - Inconsistency in service
Inconsistent service can confuse and frustrate customers, leading to dissatisfaction. It’s important for customer support teams to have a standardized approach to handling queries and issues. You can achieve this through detailed service protocols and by ensuring all team members are on the same page. - Not listening to customer feedback
Ignoring customer feedback is a significant misstep for support teams. Feedback is valuable for understanding the customer’s perspective and improving services. Regularly collecting and analyzing customer feedback helps identify pain points and areas for improvement. - Failure to follow up
Follow-ups are a simple way to show customers you value them and to ensure you’ve resolved their issue to their satisfaction. If you don’t, you can miss opportunities to build relationships and impact CSAT and NPS results.
Next to employees, customers are your most valuable asset. The more effectively you use data to understand, resolve, and eliminate customers’ issues, the more loyalty and revenue your organization will earn.
To ensure the Salesforce data you use for customer service analytics is accurate and complete, incorporate tools like GRAX into your customer support arsenal.
Leverage Data to Delight Your Customers
Tap into the power of your data history with analytics to enhance your customer service.


