GRAX helps your organization become more data-driven regardless of where it stands in its data transformation journey. GRAX History Stream was purpose-built to align tightly with how data processing works in modern enterprises. To easily unleash the value of historical Salesforce application data with out-of-the-box Amazon Web Services (AWS)1 connectivity options, GRAX leans on well-established understood formats, frameworks, and conventions.
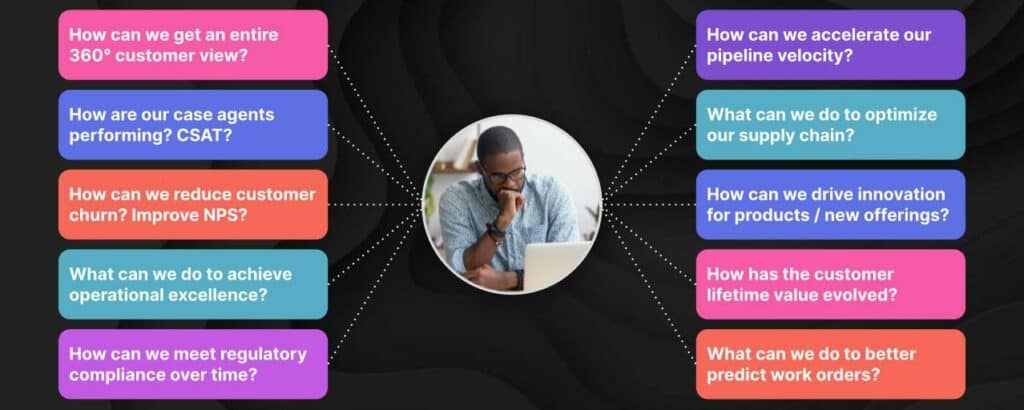
As an increasing number of enterprises invest in their data pipelines, we see this reflected in a more modern approach to analytics. In this post, we’ll take a closer look at using GRAX to feed historical Salesforce data into an AWS pipeline to answer critical business questions, namely, how to predict churn across a customer base based on real-world telecom usage data. History Stream eliminates API and ETL/ELT challenges by using the industry-standard Parquet format to make cloud application data readily available and consumable by various AWS services. The pattern described in this post is a great example of how GRAX was built to leverage native, scalable, out-of-box patterns to move your valuable historical data where your organization needs it most so that you can answer your business questions faster.
Solution Overview
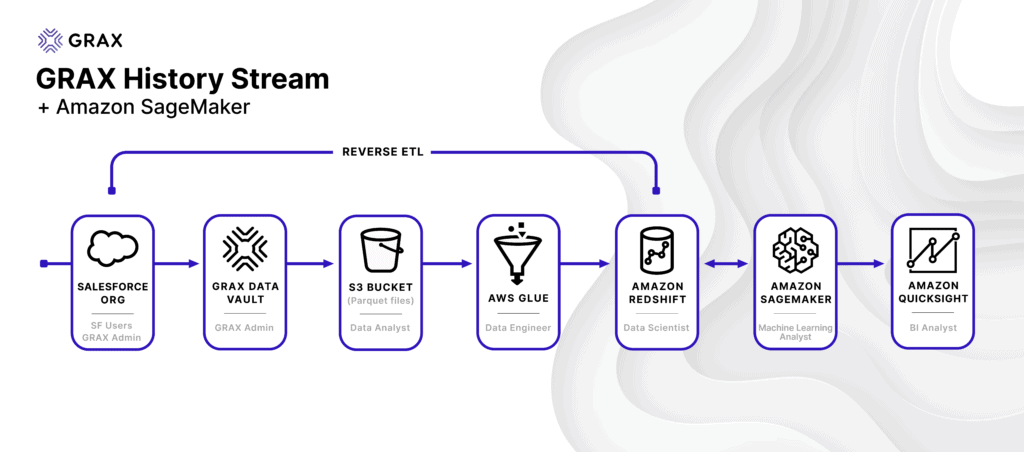
We will be looking at predicting churn across a customer base using historical CRM data made available by GRAX. The pipeline described below involves the following high-level components:
- Enable GRAX History Stream and GRAX backup and/or archive jobs to begin capturing the full history of customer data.
- Run an AWS Glue crawler to catalog GRAX History Stream data and create the relevant Glue database tables.
- Run an AWS Glue job to transform (as needed) and load data into a new or existing Redshift table.
- Create, train, and apply machine learning models through AWS SageMaker. Data analysts and database developers can even use familiar SQL commands to do this right within Redshift.
- Ingest SageMaker-powered views from Redshift into QuickSight to visualize answers to your organization’s critical business questions.
- Use the intelligence gathered from this pipeline to drive operational analytics back into your business systems.
Set Up GRAX
Enable History Stream for the desired Salesforce objects. As GRAX backup and archive jobs execute, History Stream will automatically create Parquet files in the designated S3 bucket. With a few clicks, you’re already set up with GRAX to drive downstream consumption in subsequent AWS services.
Catalog Data with AWS Glue
AWS Glue is a fully managed ETL (extract, transform, and load) service that will allow us to quickly leverage out-of-box functionality to move valuable GRAX history into other data stores for further analysis. First, we’ll create a crawler in the AWS Glue console. The crawler will connect to our history stream data in S3 and create metadata tables within the Glue database. Once set up, run the crawler on-demand or on a schedule.
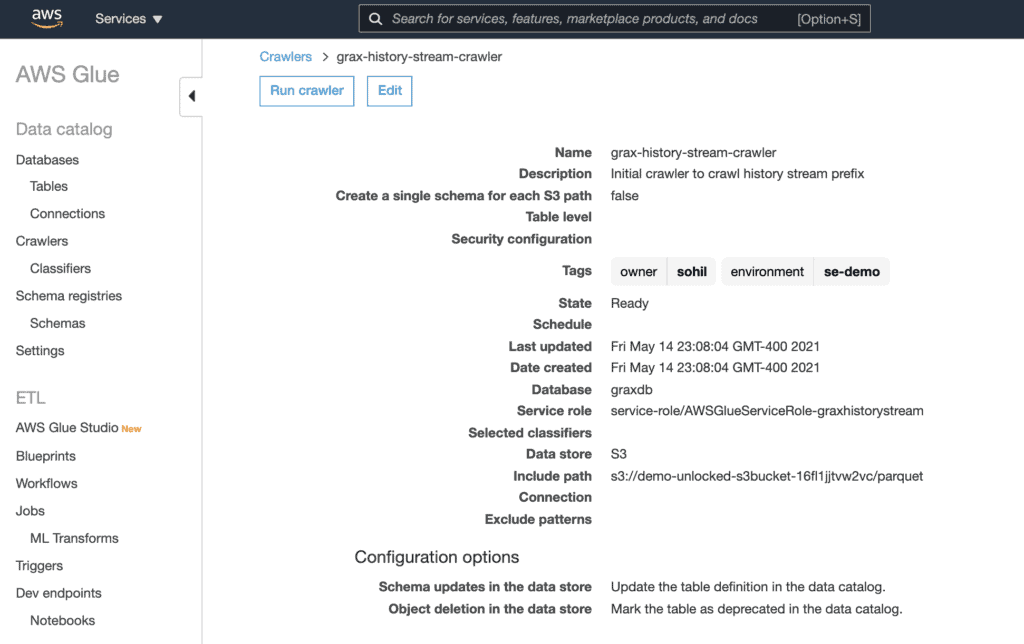
An added benefit of cataloging the data in this way is that it will now be readily available to query using AWS Athena. This is the most efficient way to run ad-hoc queries against the GRAX History Stream data in S3 without setting up or managing any servers.
Transform and Load Data into Redshift with AWS Glue
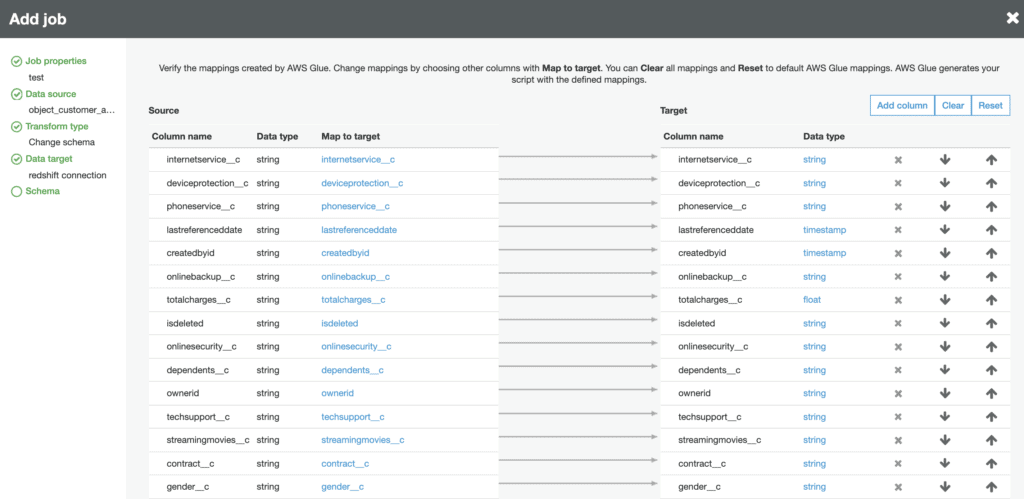
We can create a Glue job that will run and send the specified source data (Glue database table representing a Salesforce object) to the destination (Redshift cluster). Using the Glue job wizard, specify (or create new) the proper Redshift connection and database via the JDBC datastore option.
Within the Glue job wizard, you can view and update all field mappings. GRAX stores all Salesforce fields as a string within the Parquet file. This is meant to provide maximum flexibility and allows data teams to handle the Salesforce schema per their requirements. While you can specify the field mappings at this stage, we have also seen customers skip this step and instead handle field mappings within Redshift by doing things such as copying the incoming GRAX Salesforce data from an unmapped staging table to a mapped Redshift table or simply creating views with standard SQL typecasting.
Run the Glue job on-demand or on a schedule to populate the Redshift table(s).
Create SageMaker Models and Inferences
We can now leverage Redshift ML as an easy way to take advantage of SageMaker, which is the powerful AWS service that allows you to build, train, and deploy high-quality machine learning models. This will allow us to create SageMaker ML models and inferences easily using SQL.
As we’re looking to predict customer churn based on the historical data we have been capturing via GRAX, the below sample command will create a model named grax_churnchurn__c field. We are creating a function named predict_churn that we will be able to use in future SQL queries once the model is trained and ready. This will build a model that learns from all the historical data ingested, and then we can feed it any other datasets to ask the model to predict churn.
CREATE MODEL grax_churn
FROM demo.public.object_customer_account__c
TARGET churn__c
FUNCTION predict_churn
IAM_ROLE 'sample-role-ARN'
SETTINGS (
S3_BUCKET 'sample-bucket'
);
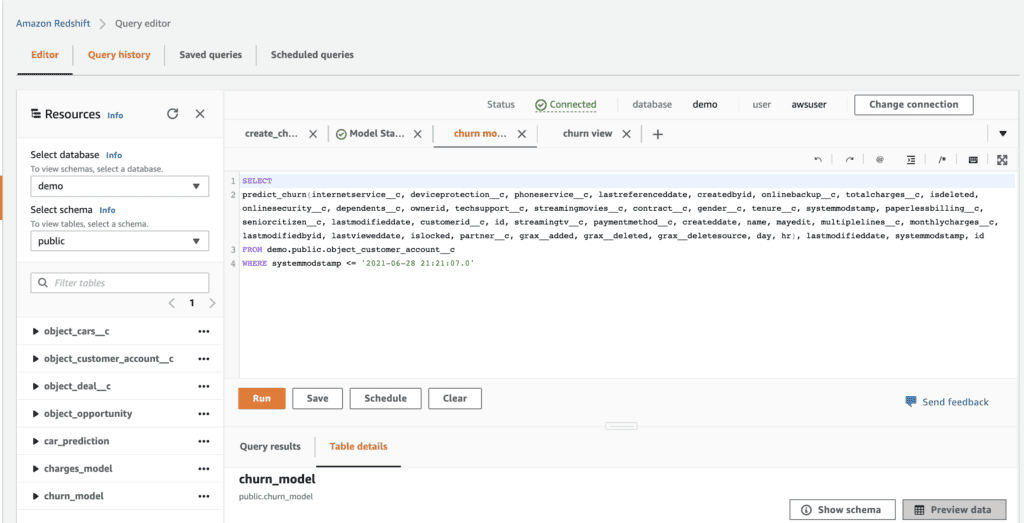
Once the model is ready (which can take hours), we can then create Redshift views based on inference queries. Let’s go ahead and create a churn view based on this model, predicting churn based on a variety of input fields for a particular filtered dataset.
CREATE VIEW churn_model
AS
SELECT churn__c,
predict_churn(internetservice__c, deviceprotection__c, phoneservice__c, lastreferenceddate, createdbyid, onlinebackup__c, totalcharges__c, isdeleted, onlinesecurity__c, dependents__c, ownerid, techsupport__c, streamingmovies__c, contract__c, gender__c, tenure__c, systemmodstamp, paperlessbilling__c, seniorcitizen__c, lastmodifieddate, customerid__c, id, streamingtv__c, paymentmethod__c, createddate, name, mayedit, multiplelines__c, monthlycharges__c, lastmodifiedbyid, lastvieweddate, islocked, partner__c, grax__added, grax__deleted, grax__deletesource, day, hr), internetservice__c, deviceprotection__c, phoneservice__c, lastreferenceddate, createdbyid, onlinebackup__c, totalcharges__c, isdeleted, onlinesecurity__c, dependents__c, ownerid, techsupport__c, streamingmovies__c, contract__c, gender__c, tenure__c, systemmodstamp, paperlessbilling__c, seniorcitizen__c, lastmodifieddate, customerid__c, id, streamingtv__c, paymentmethod__c, createddate, name, mayedit, multiplelines__c, monthlycharges__c, lastmodifiedbyid, lastvieweddate, islocked, partner__c, grax__added, grax__deleted, grax__deletesource, day, hr
FROM demo.public.object_customer_account__c
WHERE systemmodstamp <= '2021-06-28 21:21:07.0'
Visualize in QuickSight
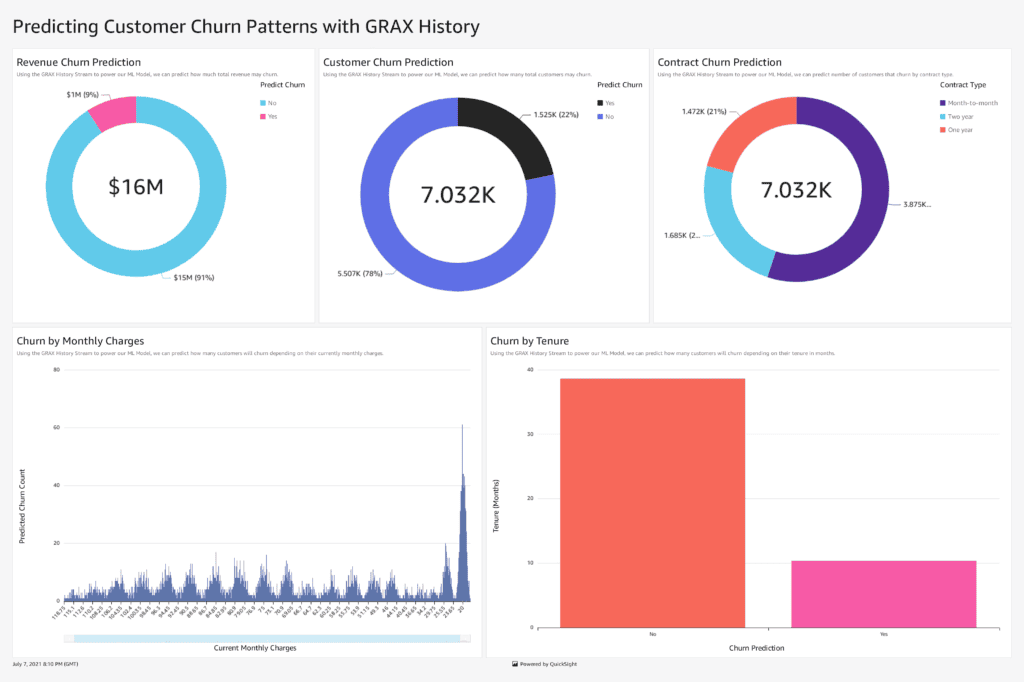
With a few clicks, you can easily import the Redshift view that predicts churn into QuickSight, AWS’ business intelligence service. Easily share the ML-powered dashboards with key stakeholders to facilitate data-driven answers to your business’ most pressing questions. In the image below, we can see that churn is most likely in customers tenured 10 or fewer months and on month-to-month contracts. We also see that roughly $1M of revenue (or 9% of our revenue) is predicted to churn.
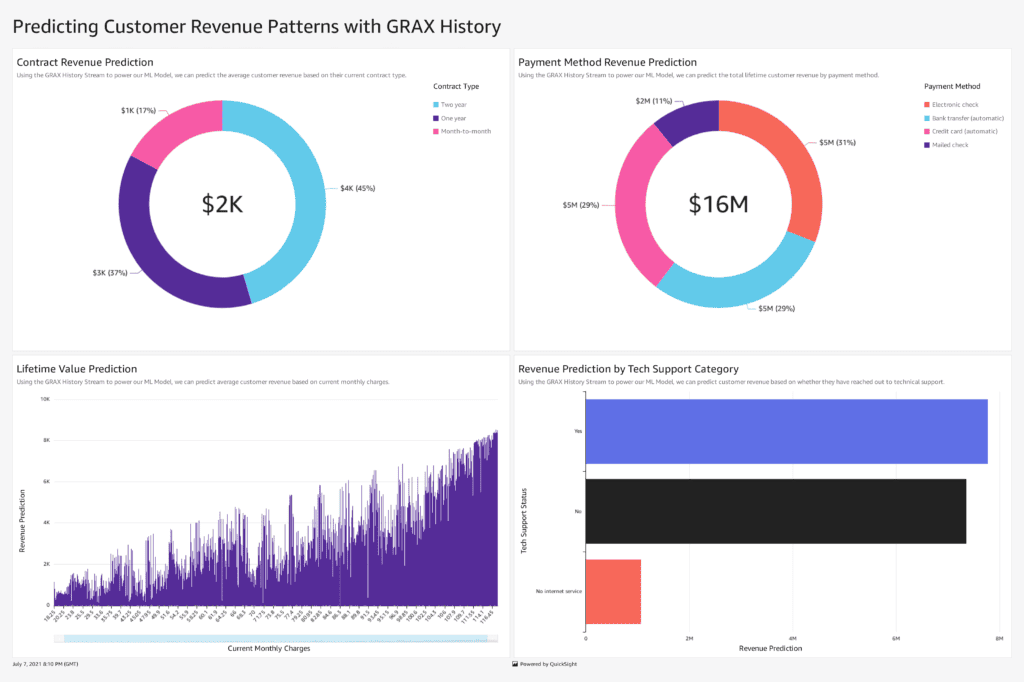
You can also follow the process described here to create and visualize a similar model that predicts revenue based on GRAX-powered historical Salesforce data. Here’s a look at the type of QuickSight dashboard made possible when repeating this process to generate revenue predictions. Here, our growth team may want to direct additional resources towards segments that are not predicted to generate as much revenue, those on month-to-month contracts and paying by mailed checks, with the goal of moving these customers into the two-year contract segment that pays electronically and leverages tech support, high predictors of revenue.
See GRAX History Stream + Amazon QuickSight in Action
Drive Operational Analytics
We’ve seen how GRAX can take SaaS app data from key business systems, like Salesforce, and build a data pipeline using out-of-the-box features from AWS services. As we see above, the business intelligence derived from having this churn prediction data in Quicksight can be invaluable. Customer marketing managers can now make more informed decisions on how best to create campaigns targeting customers with low-churn indicators. Support and customer success leaders can now organize campaigns around proactively reaching out to the high-risk churn segments. But what’s next?
Enterprises invested in treating their data as a product will want to go even further. Modern data teams are turning this historical data into operational analytics to create information feedback loops that can transform a business. A reverse ETL process can take all of these GRAX-powered insights gleaned from our data warehouse and surface these as actionable workflows and new data points back in our business systems of record.
Now that we’ve been able to capture massive evolving datasets out of Salesforce and predict churn and revenue, we can connect back to Salesforce and tag accounts with churn predictions, create forecast opportunities with our revenue predictions, and assign tasks to follow up on accounts predicted to churn or fall short of revenue goals.
Let’s take a closer look at completing the last mile of operational analytics, syncing our data back to where we need it day-to-day:
- A reverse ETL tool will allow you to sync the Redshift churn and revenue prediction views back to a Salesforce object, such as our Accounts.
- Map the churn prediction and lifetime value (LTV) predictions generated from our ML models to Salesforce fields.
- Create a visual indicator that shows up for these high-risk accounts, as you can see we’ve done on our Account with a conditionally visible lightning alert message.
- Optionally, create another reverse ETL sync to generate follow-up tasks for each Account predicted to churn, as you can see we’ve done below.
- Finally, embed a Salesforce Tableau CRM dashboard to view the predicted revenue for each account easily.
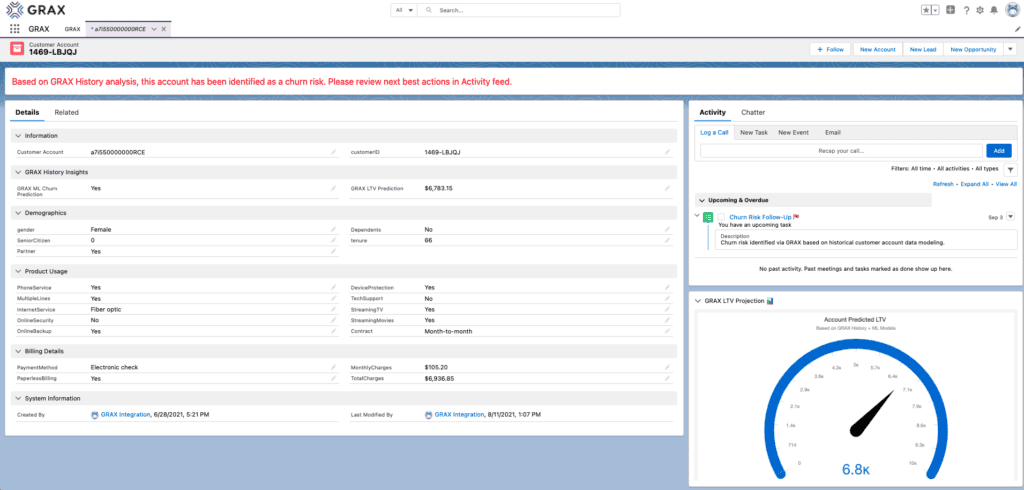
In short, we’ve operationalized our analytics. The newly created Salesforce data will, in turn, further feed into the GRAX backups and start the process all over again, creating our data value flywheel.
Conclusion
As more and more enterprises look to modernize their data infrastructure and foster a data-driven culture, the key to achieving these goals lies within capturing and owning all the historical snapshots and changing datasets within your critical business systems and seamlessly making these datasets available to your data pipelines. GRAX allows you to capture this business data, make it available to AWS services, and ultimately drive analytics and business intelligence. Even more, you can do this all within your own public cloud infrastructure, maintaining complete ownership and reuse of your data at the networking, compute, and storage layers.
Whether you’re just beginning to introduce a data warehouse to your organization or looking to extract more value from a more advanced enterprise data stack, owning and unlocking your Salesforce and other SaaS application data in a way that conforms to both your current and forward-leaning AWS data strategy is critical in reducing time-to-value, increasing adoption, and proactively setting a foundation across all of your data teams. This could manifest via analyzing historical patterns in Sales Cloud opportunities, Service Cloud cases, or other evolving business data within Salesforce. As your enterprise seeks to become more data-driven, it is not enough to just backup, archive, and restore Salesforce data. Moving up the data value curve has become more important now than ever. GRAX can help your organization achieve this by making your historical data readily available to all of your downstream AWS platforms and services.
See GRAX History Stream + Amazon SageMaker in Action
Please note that the patterns detailed in this post are not meant to be instructions but rather real-life examples of what is possible to do with GRAX History Stream. With the help of your AWS team or data teams, they can help you better understand what will work best within the context of your enterprise’s data architecture. Ready to learn more? Get in touch.
[1] A similar pattern will work in Microsoft Azure and Google Cloud Platform.


