From Data to Decisions: Integrating Salesforce Data into Tableau with GRAX
Explore the capabilities of GRAX for Tableau Connectors in our latest video demo. This detailed walkthrough illustrates how GRAX seamlessly enables the integration of Salesforce data into your Tableau reports via Tableau Server connectors, dramatically enhancing the efficiency and depth of your historical data analysis.
What’s covered in the GRAX Tableau Connectors Video:
- Effortless Data Integration – Directly connect to your data — your entire Salesforce history — as your data source with the GRAX data connector, facilitating near real-time access to Salesforce data across both Tableau Desktop and Web platforms.
- Capture Comprehensive Data Histories – Replacing traditional point-in-time snapshots that miss 99% of all changes – GRAX gives you your entire history at your fingertips. GRAX ensures a complete historical capture, providing a thorough view of your data over time.
- Powered by Data Automation – Leverage GRAX to automate data processes — continuous data collection and replication — enabling more precise and dynamic reporting within Tableau. This technology simplifies the transformation of sales and service data into insightful, actionable reports.

Key Highlights
- Dynamic Data Snapshots – Easily pull various types of Salesforce data into snapshots — daily, monthly, or custom snapshots — into Tableau for historical snapshot reporting.
- Customizable Reports – Learn how to customize your Tableau reports by choosing specific fields from the data pane, ensuring that the dataset aligns perfectly with your analysis needs.
- Interactive Tableau Features – Discover how to utilize Tableau’s tools to manipulate and display data, including using dimension fields for detailed and visually compelling Tableau visualizations.
- User-Friendly Interface – GRAX for Tableau offers a streamlined, intuitive interface that simplifies data handling, making it accessible for users of all technical levels.
- Performance Data Insights – Gain deeper insights into your organization’s performance through near real-time updates and rich visualization tools, enhancing your strategic decision-making processes.
The GRAX for Tableau Connectors is designed to not only meet but exceed the demands of modern data professionals, ensuring your entire history is accessible for maximum impact.
Watch our video to see how GRAX for Tableau can revolutionize your analytics and data strategy.
Unlock Powerful Insights with Expert Guidance
Elevate your Tableau reporting with GRAX. Click here for a free expert consultation!
Harnessing GRAX Tableau Connectors for Advanced Analytics Video Transcript
Good afternoon, Joe Gaska with GRAX. Today we’re going to be demonstrating GRAX for Tableau.
Now if you look down, I’ve clicked on ‘To a Server’, ‘More…’, and underneath more you see GRAX for Tableau by GRAX.
I’m simply going to click. It’s going to pop open GRAX for Tableau.
Now you are immediately prompted to enter your GRAX URL and your GRAX token.
Inside of GRAX you can create a token to securely connect to your GRAX deployment. And there you are – connected directly to GRAX.
You can see that every object that is in GRAX is available to pull down directly into Tableau.
And you can run monthly, daily, or single snapshots of data, which will pull the data directly from GRAX directly into Tableau.
You can specify any fields on any object.
We have practically saved three demonstration snapshot reports: opportunity, case, or lead snapshots. All of these are historical snapshots.
So I’m simply going to scroll down and click ‘Run snapshots’. And what’s happening behind the scenes is it’s connecting directly to the GRAX servers, and running 12 snapshots and pulling that data directly into Tableau.
The data is being aggregated. All the fields that you’ve specified in the fields list right there automatically are populated inside of Tableau.
Boom, there you go.
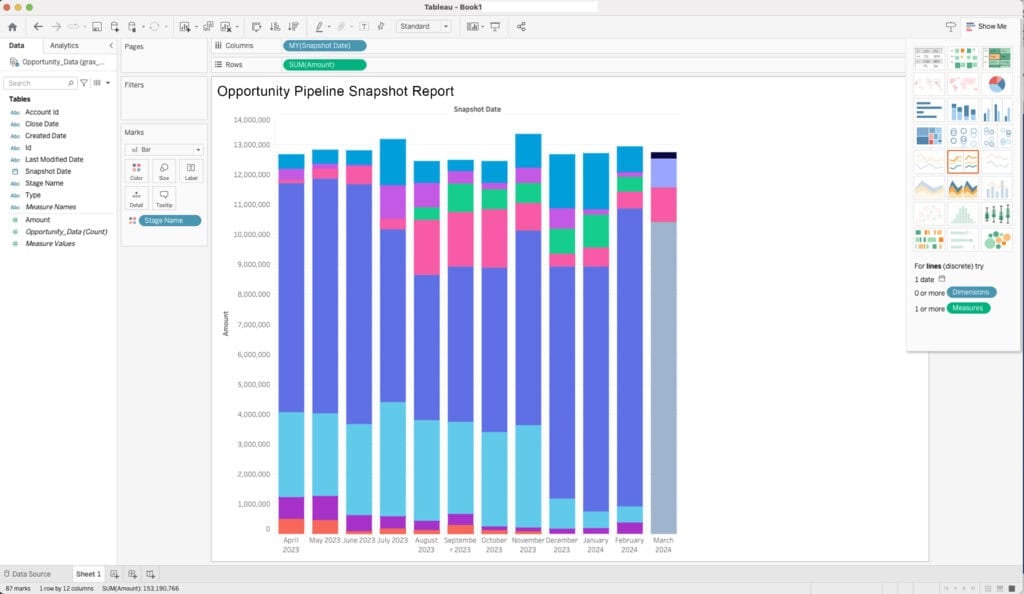
I’m simply going to click ‘Go to sheet’. And I’m going to build a quick dashboard with this historical data.
I’m running a historical pipeline report. Salesforce has one version of data, with GRAX you have them all.
So I’m building a historical pipeline. So you can see the fields automatically are brought up. I’m going to simply click ‘amount’. I’m going to change the data type to decimal.
I’m going to go down to snapshot date. I’m going to change this to convert to date. I’m going to drag stage name up into columns.
I’m going to grab snapshot date, put it into rows. And I don’t want the year to be aggregated. I’m going to simply click ‘more’. I’m going to click ‘custom’. And I’m going to change it to month/year. Just because I like it.
And then all I’m simply going to do is click on ‘amount’ and convert to measure. Drag this into the report. And there you are a complete 12-month historical pipeline in less than four minutes.
Thank you!
Ready to Take Your Data to the Next Level?
Tap into the full potential of your data with GRAX Tableau Connectors.


